Sales & stores
SALESAds bring the visit; the store and the sales team close it. This is where the store, CRM and tracking work lives — checkout, catalogue feeds, and how fast sales answer. The screenshots here show the money that actually landed, not the ad platform’s version of it.
When the gap between platform numbers and store numbers widens. The number I hold myself to is the one in the store dashboard or the CRM, and that is the one that goes in the report.
If the team will not answer leads in a reasonable time. The fastest campaign in the world cannot survive a team that replies two days later, and that is an operations problem, not an advertising one.
The screenshots
12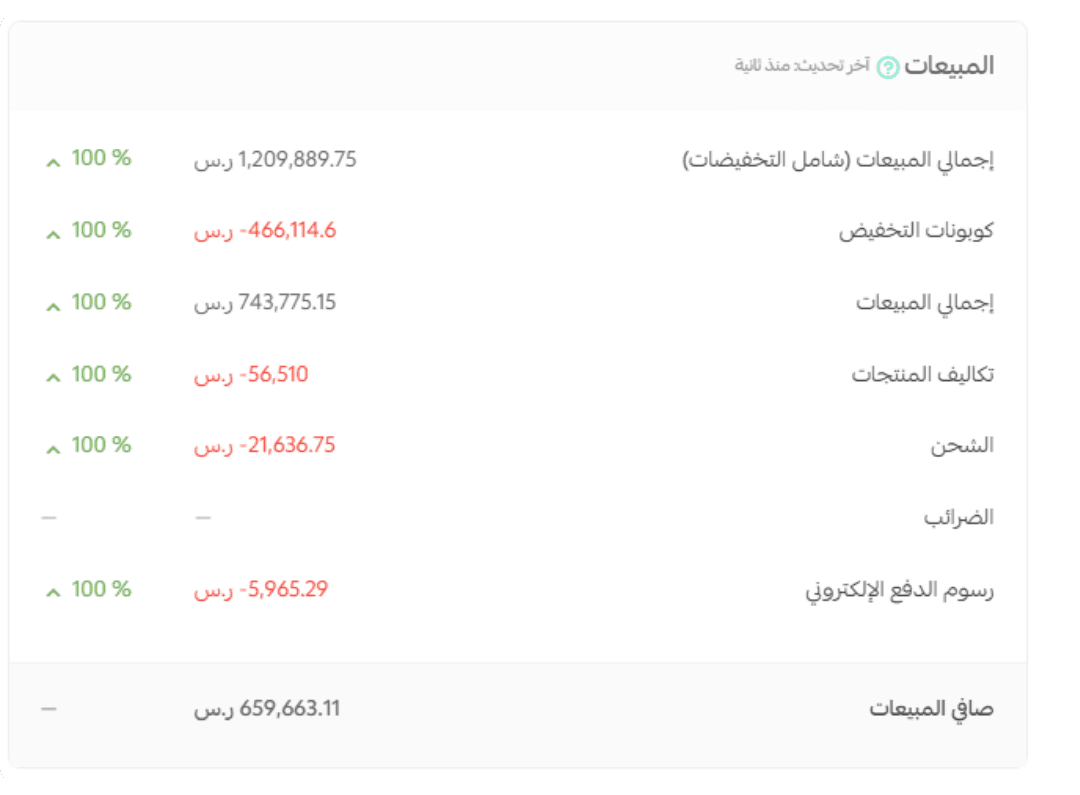 SAR 659,663 net
The most important shot on this page. Gross sales of SAR 1,209,889 — and after coupons (SAR 466,114), product cost, shipping and payment fees, the net is SAR 659,663. Nearly half the number disappears. A media buyer shows you the first figure; I hold myself to the last one.
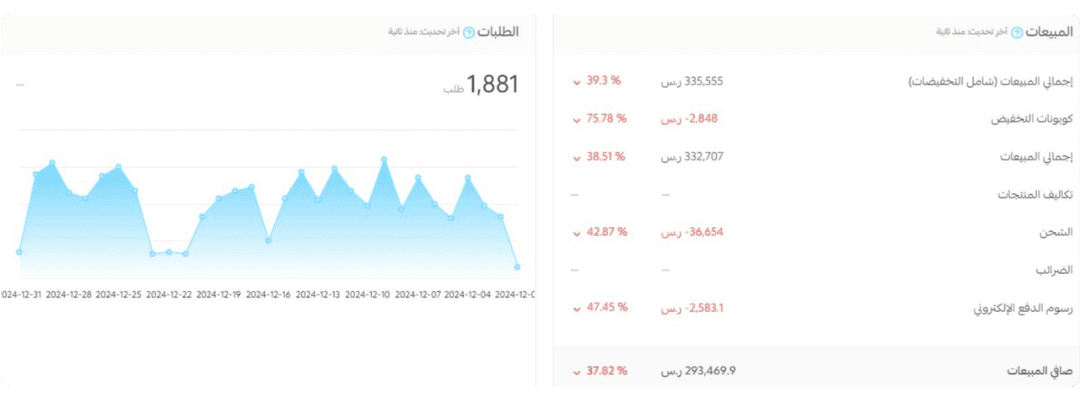 1,881 orders
A month at 1,881 orders and SAR 293,469 net. Shipping alone consumed SAR 36,654 — more than ten times the coupons. Any Saudi account that leaves shipping out of its margin maths is reading a profit that is not there.
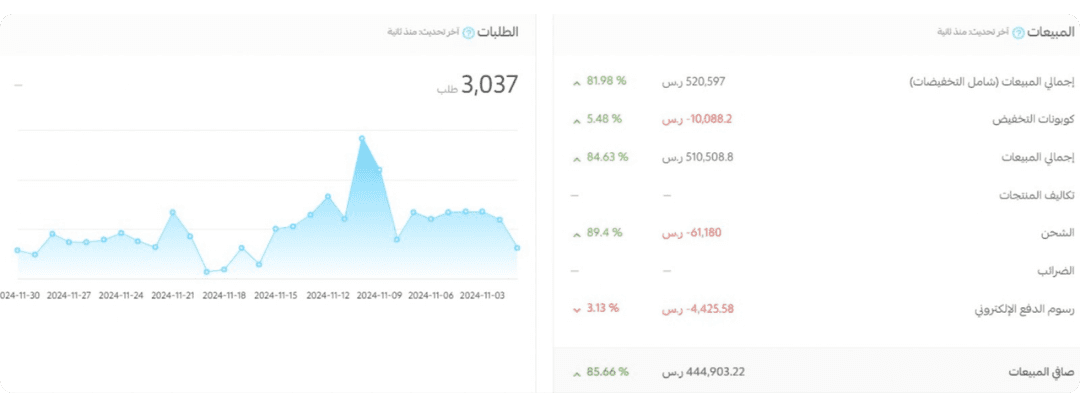 +85.66% net
3,037 orders and SAR 444,903 net, up 85.66% on the prior month. The spike on 10 November is not luck — it is a seasonal campaign prepared a month ahead. Season planning happens while you are still outside the season.
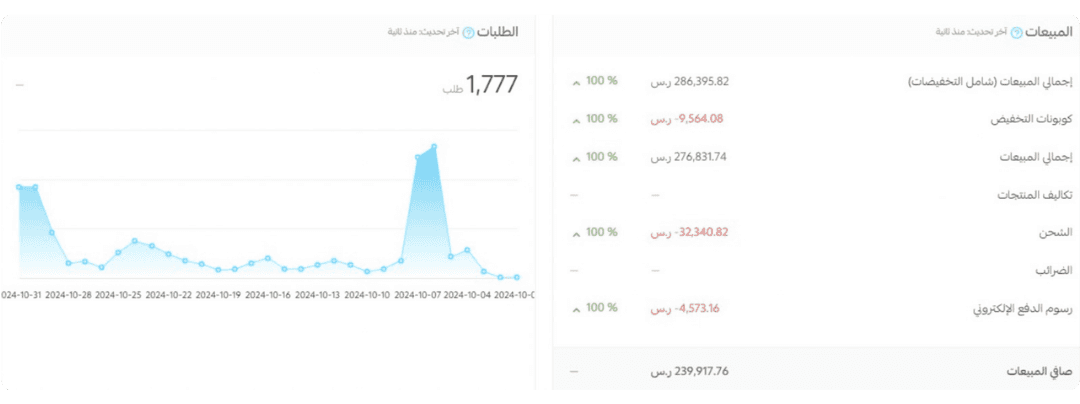 1,777 orders
1,777 orders and SAR 239,917 net. Look at 7 October: a sharp one-day spike that returns straight to baseline. That single day moves the monthly average on its own, which is why judging an account on a daily mean misleads you.
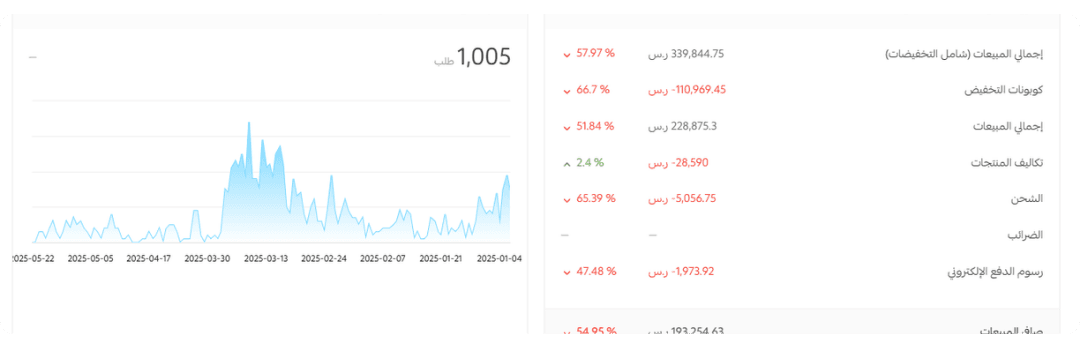 −54.95% net
The bad number, and it is here on purpose. 1,005 orders with net down 54.95%. The cause is right there on screen: coupons ate SAR 110,969 out of SAR 339,844 — a third of sales went to discounting. A discount is not a growth tool, it is a loan against your margin that you repay every month.
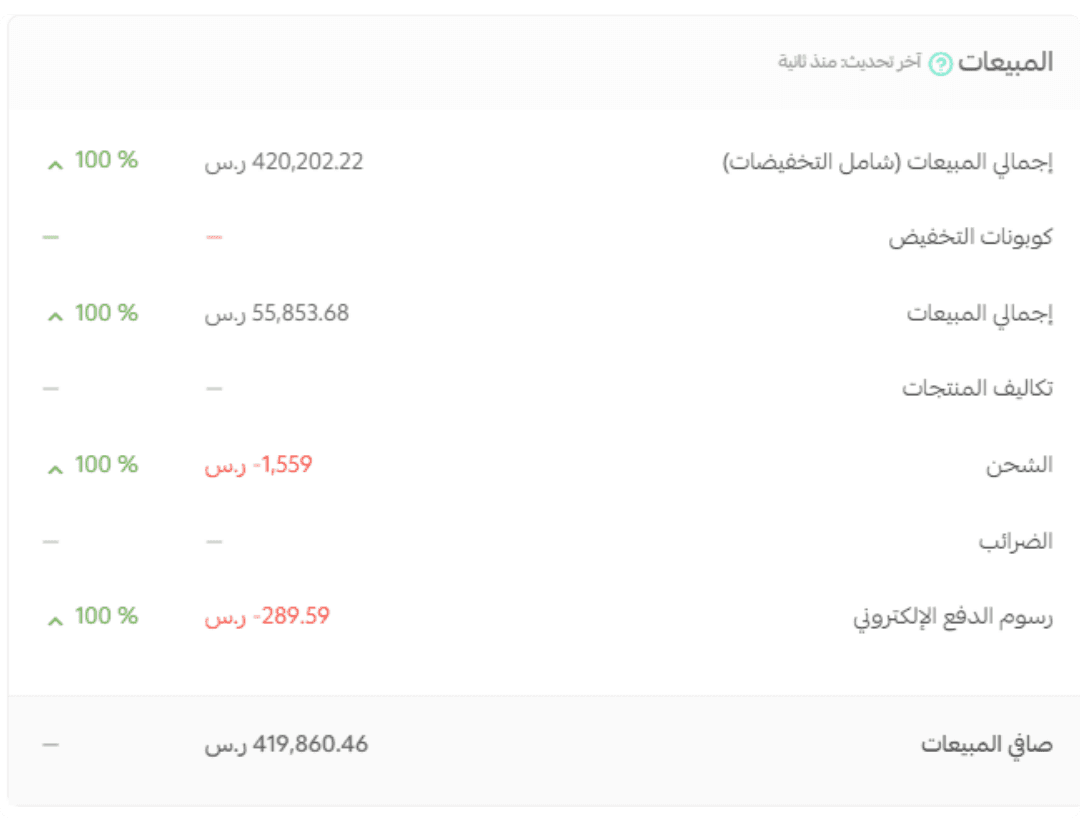 SAR 419,860 net
An account with no coupons at all: SAR 420,202 gross and SAR 419,860 net — the entire difference is SAR 1,848 of shipping and payment fees. Compare it with the previous shot: roughly the same sales volume, more than double the difference in net. That is not advertising work, it is a pricing decision.
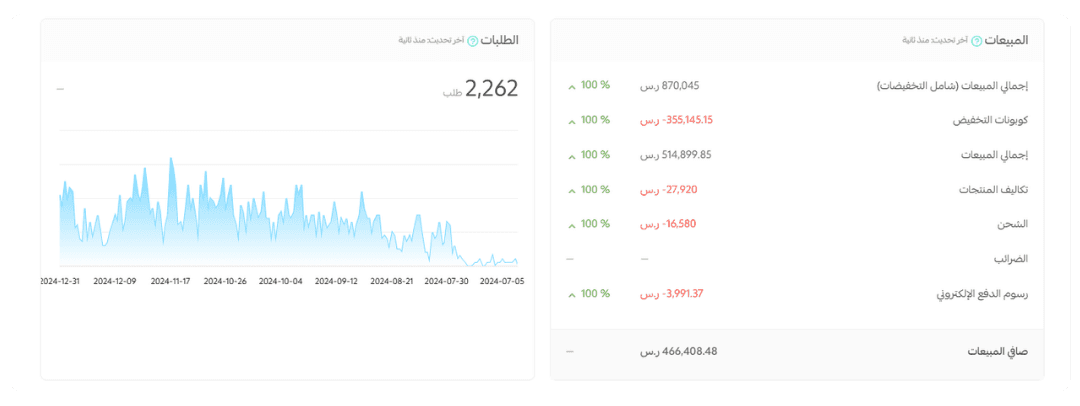 2,262 orders
Six months: 2,262 orders, SAR 870,045 gross, SAR 466,408 net. Coupons alone accounted for SAR 355,145 — 41% of gross. And the chart shows orders declining from October to December. The two are connected: once you train a market on discounts, it waits for the discount.
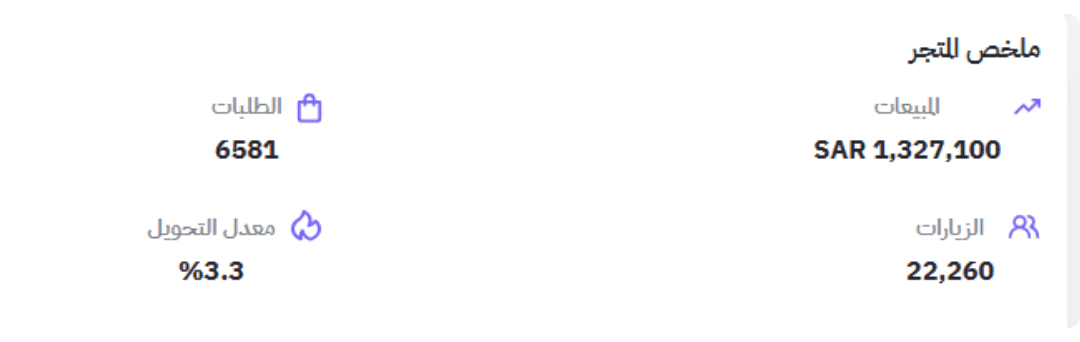 3.3% conversion
Store summary: SAR 1,327,100 in sales from 6,581 orders and 22,260 visits, converting at 3.3%. That rate decides what you can afford to pay for a visit. At 1.5% instead of 3.3% the identical ad at the identical cost becomes a loss — and the difference is in the site, not the campaign.
 4,710 orders
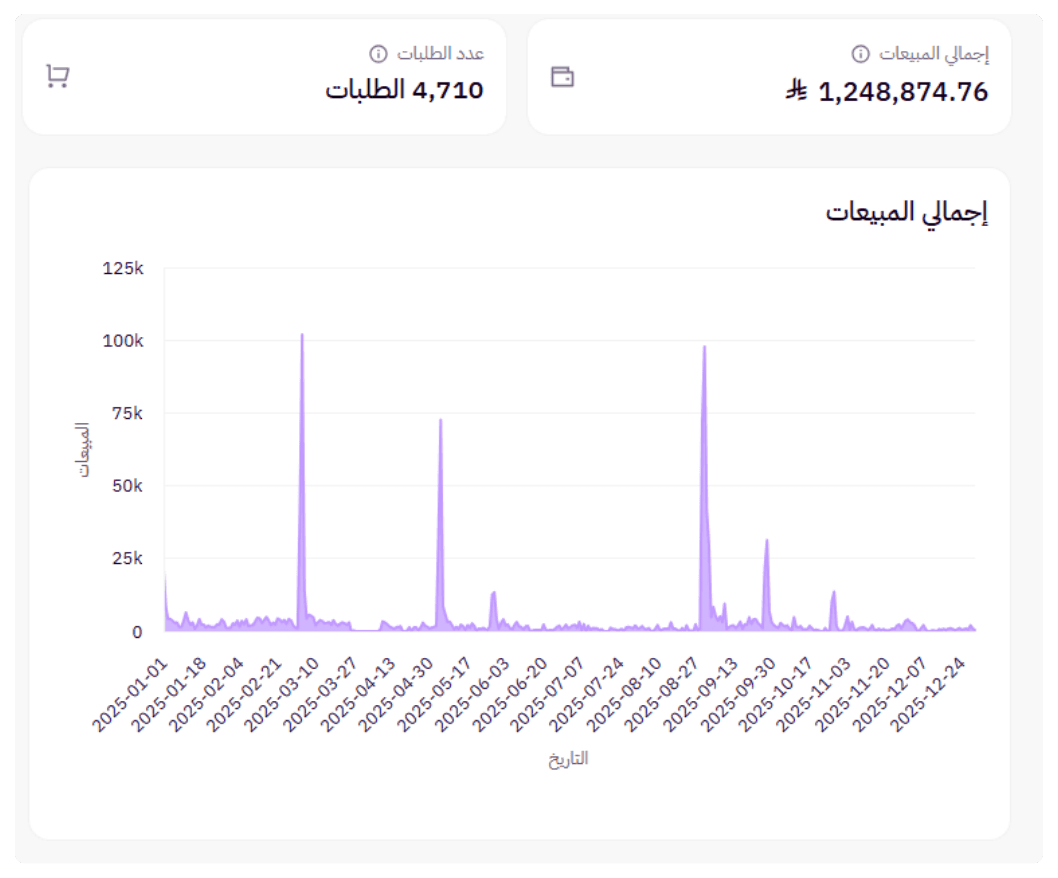
A full year: SAR 1,248,874 from 4,710 orders. Three clear peaks in March, May and September, and a near-flat line in between. This account lives on its seasons, which means budget has to move with the peaks rather than being spread evenly across twelve months.
 SAR 725,168
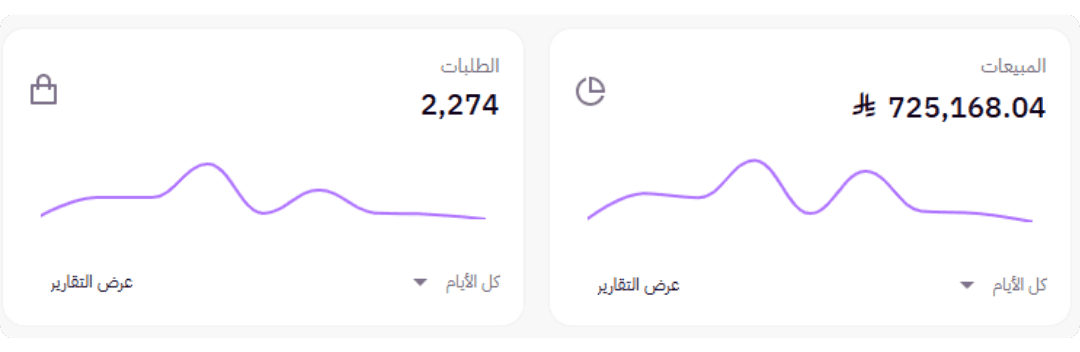
2,274 orders worth SAR 725,168 — an average basket around SAR 319. Average basket sets the ceiling on acquisition cost, and anyone who asks me "what ROAS?" before telling me their basket size is asking the wrong question.
 277 orders
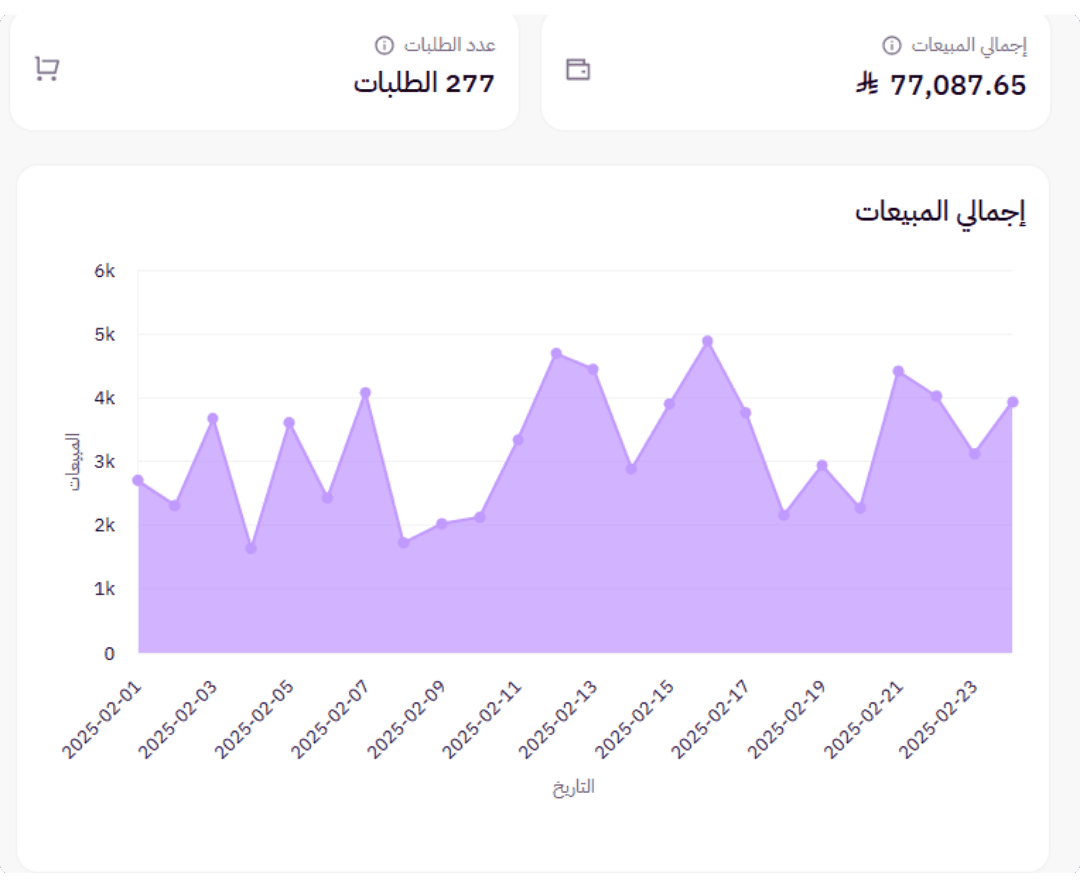
A small store: 277 orders worth SAR 77,087 in a month. It sits beside the million-riyal accounts because the same method works at both sizes. The difference is that here every decision shows up faster, because there is no volume to hide a mistake behind.
 4.10% conversion
The lifetime picture for one store: SAR 5,273,829 in sales, 16,707 orders, 404,839 visits, converting at 4.10%. Conversion is rising while visits fall — that is the signal that the traffic got cleaner, and it is worth far more than visit growth.
Start with a free 15-minute conversation about your business and goals. If there is a fit, we agree the scope of a paid audit, then define the plan and follow-up.